%2010.27.06%20a.%C2%A0m..png?width=2879&name=Captura%20de%20Pantalla%202021-10-28%20a%20la(s)%2010.27.06%20a.%C2%A0m..png)
Thank you for visiting our October product updates blog. Take a look at what AKTEK has been up to this month. Already a customer? Go to our helpdesk and check the step-by-step guide to leverage these new features and updates.
3,2,1 … AKTEK iO Mobile App!
We recently launched our mobile app for AKTEK iO and are excited to share what you'll be able to do with it. While this list is not comprehensive, and we are still working on adding more functionalities and capabilities, we can tell you that with our mobile app, you'll be able to:
- Using the mobile app, enter data into your existing data structures directly from the worksite or the field. To log in, use the same credentials you have for the web app.
- View and consult folders and reports based on your permissions.
- Interact with data (view, add, edit, delete) based on your permissions.
- Interact with the app with your configured language and theme.
%20(1).png?width=2240&name=Blog%20Post%20Banner%20(32)%20(1).png)
Download AKTEK iO mobile from the App Store and Google Play and send your feedback to your account manager. This is only a Beta app, and we are still improving it.
In the next update, you will even be able to save the data on the mobile app without an internet connection, and it will automatically upload as soon as you are connected again!
Ready to get started on AKTEK iO?
Click here to learn more.
Tips to Increase Your AKTEK iO Productivity
To increase your productivity on AKTEK iO, here are some tips:
View different sections side by side
If you want to compare your data table with the chart, map, or any analysis graph, here is a nifty trick!
Drag the desired tab, and it will show a shadow of where you can drop it and the space it will take. Drop it at the desired place, and voilà! (check the simple steps below).
You can do it vertically or horizontally, and you can split the screen as much as you need.
Close all (or some) open tabs
After opening some data structures, some records, analysis dashboards, and other elements, your view may become cumbersome. All you have to do is to right-click on a tab that will show the following options: Close, Close others, Close tabs to the right, Close all.
Add interpretation next to your charts
You have collected the data, built the dashboard with different graphs and maps. What's next?
The critical part starts now. Analyzing the data, making conclusions, taking action!
With the sophisticated text editor tool on the dashboard, we suggest adding your interpretation and conclusions next to the charts.
Bonus tip: Create a new data structure to track your action points to make sure to close the loop. Don't forget to add references between collected data and related actions.
Come back to your dashboard and add a chart to track the action points! (i.e., open, in progress, closed)
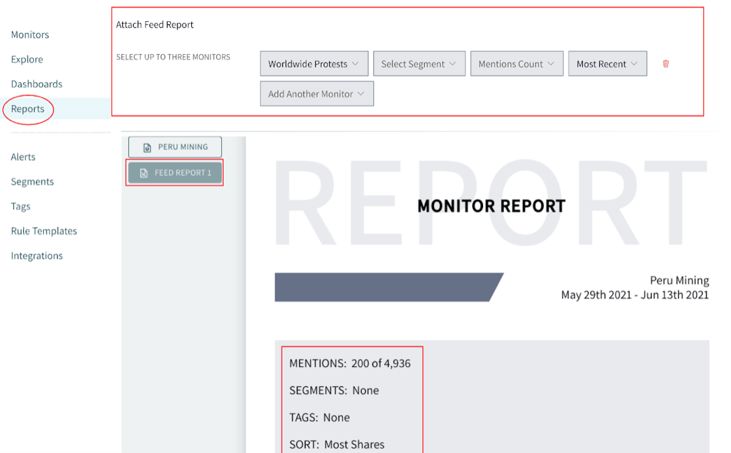
Don't forget to add feed reports to your MEDIA reports!
Feed reports allow you to attach sample mentions to your MEDIA reports. By selecting to attach feed reports, you will add the number of chosen mentions to the end of the PDF report. You can choose to add a feed report from up to 3 monitors. You can choose if you want to add 50, 100, or 200 mentions. These mentions can be the most recent, with the most reach, likes, shares, or replies.
Go to Listen > Reports > Create or edit a report > Attach feed report.

Want to explore these features? Request your free demo and see the full capabilities of AKTEK iO.


.png?width=2240&name=Blog%20CTA%20(28).png)