As we enter 2023's Q2, we continue with our commitment to provide you with the best iO experience possible by bringing enhancements and new functionalities to streamline your day-to-day intelligence management processes.
Already a customer? You can explore the updates in-depth by logging into your helpdesk account.
iO's New User Interface
Upon logging in to iO, you'll immediately notice a new and fresh design. We aim to create a more user-friendly and comfortable data management interface.
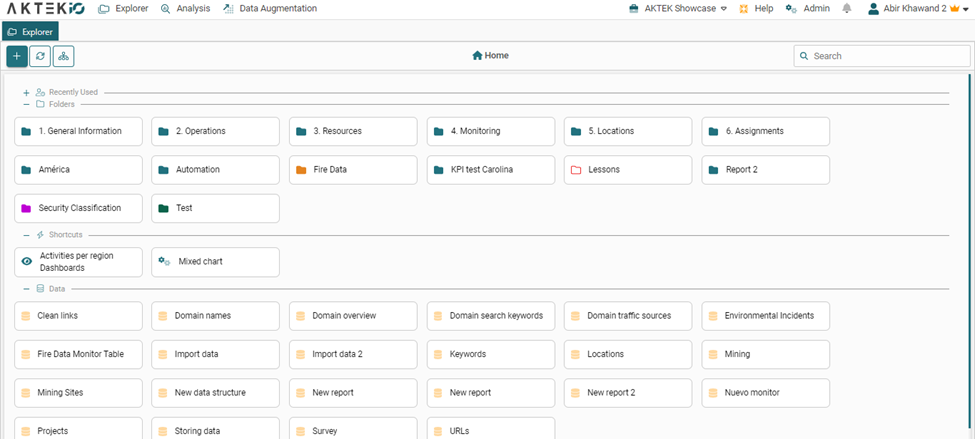
The immediate changes have been implemented on the Explorer and Admin pages.
- We've modified the size, alignment, and placement of folders and data tables for the Explorer page.
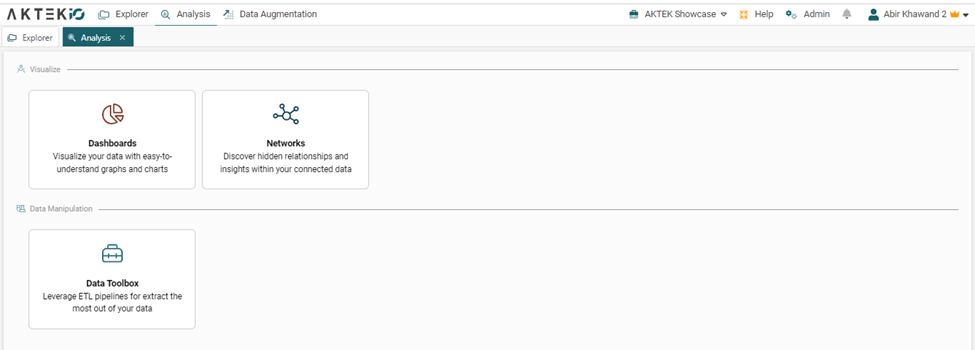
Additionally, the top bar has undergone some changes. Under Analysis, you'll now find Dashboards, Networks, and Data toolboxes, depending on which features are enabled under your license.
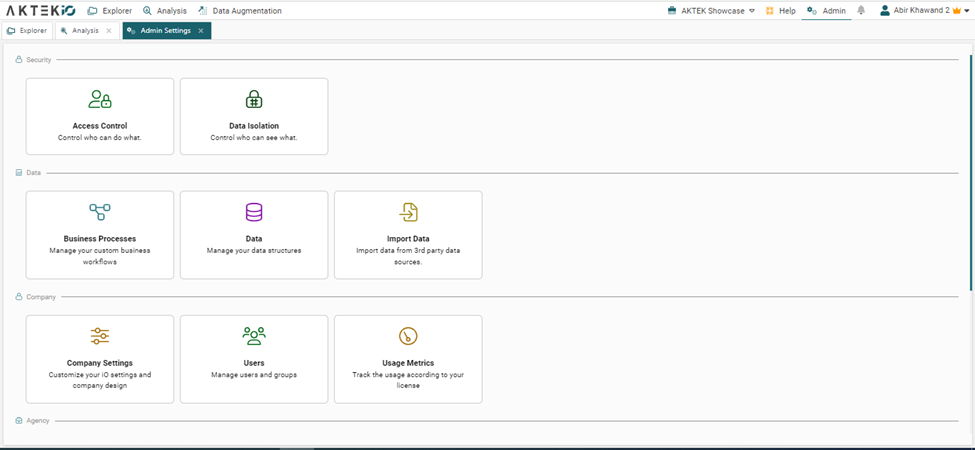
- We've categorized sections on the Admin page. Some of the sub-sections have been relocated. We'd like to encourage you to revisit sections and explore the new distribution of sub-sections. Role permissions can be found under Access Control.
As always, we value your feedback. Please let your account manager know how you feel about these changes.
Data reports
Bulk data entry
You may have noticed the settings icon if you have attempted bulk data entry in the matrix view. Currently, there are two available options:
- Case sensitivity: This feature is now turned off by default, meaning that lowercase and uppercase entries will be treated as separate values.
- Split GPS: Enabling this option will display two separate columns on the screen where you can individually enter the latitude and longitude values. However, after saving, the system automatically merges these values into a single GPS field.

Description Display
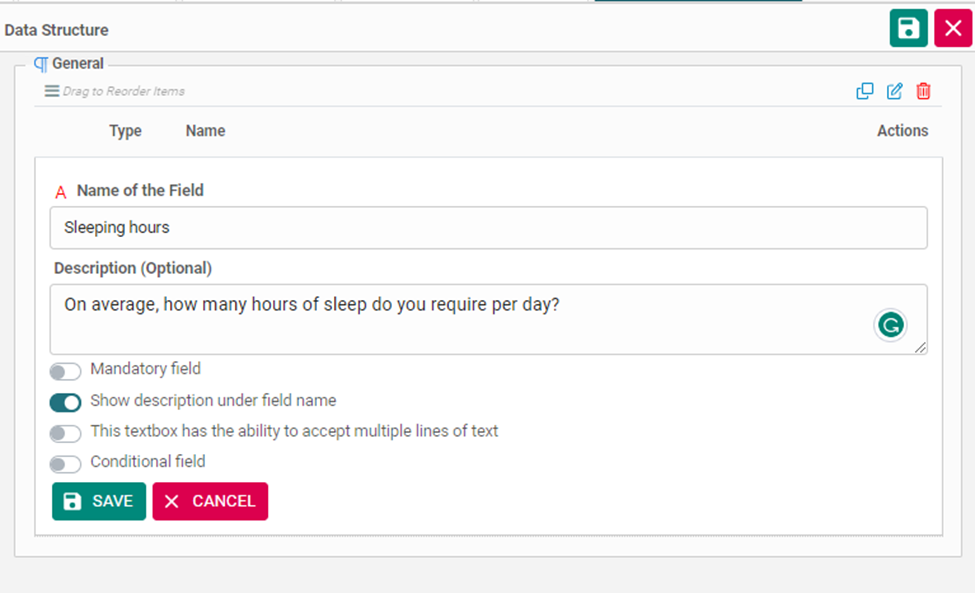
We added a new toggle option under your data structure's fields configuration. This option enables you to exhibit the description of a field beneath its name on data entry forms. This feature is handy for surveys, where lengthy text or questions must be visible to users, but field names should remain brief and concise on the dashboard and analysis.

Dashboard
Radar Chart and Pie Chart
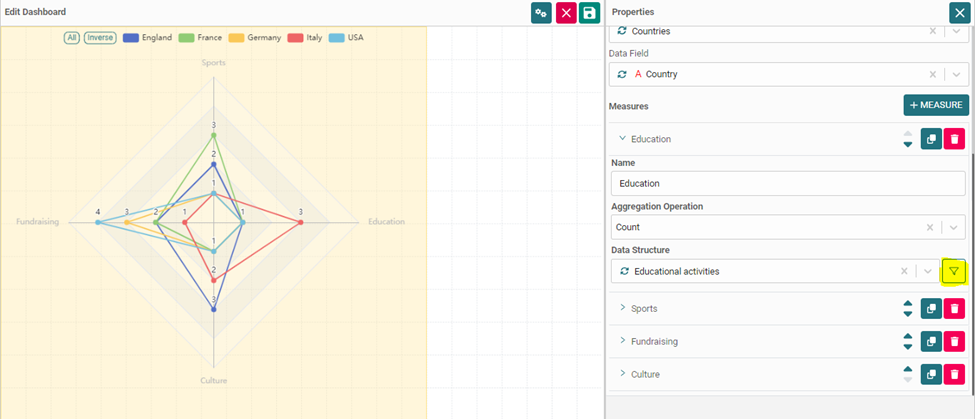
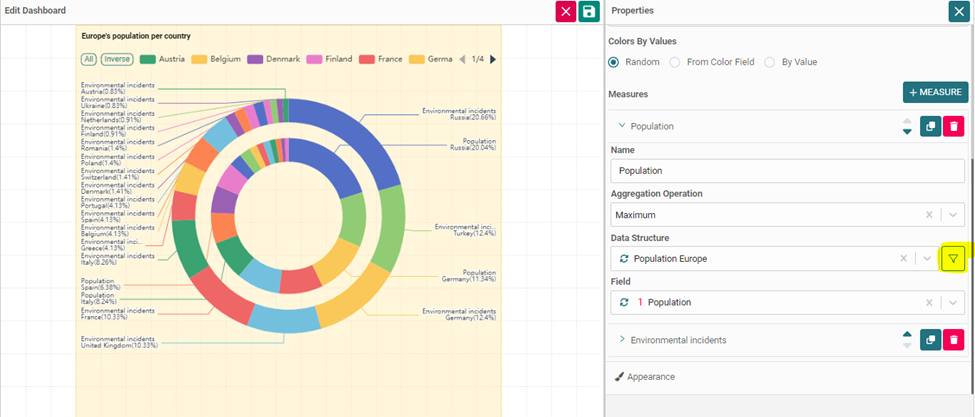
For the best use of your data, we have added the possibility of filtering the measures added to the chart.
KPI
We recognize the significance of this component to our users, and as such, we have implemented these enhancements:
- Ability to filter measures to obtain data subsets that are relevant to you.
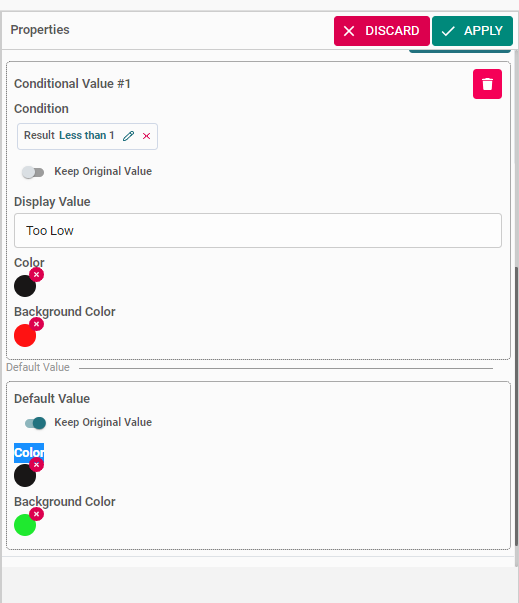
- Customize the text color, background color, and displayed value based on the chosen aggregation results.
For instance, if the result is either zero or negative:- Set a condition (less than 1)
- Display the original value (e.g., 4) or substitute it with a message such as "Too low" on the Display Value.
- Set the background color to red.
- Set the text color to black.
- You may repeat these steps to establish the default behavior or to add additional conditions.
Geo Maps
We are excited to announce a significant enhancement in the speed and performance of the map feature. You can now interact smoothly with a million data points on the map, as we now support Google Maps with all its benefits.
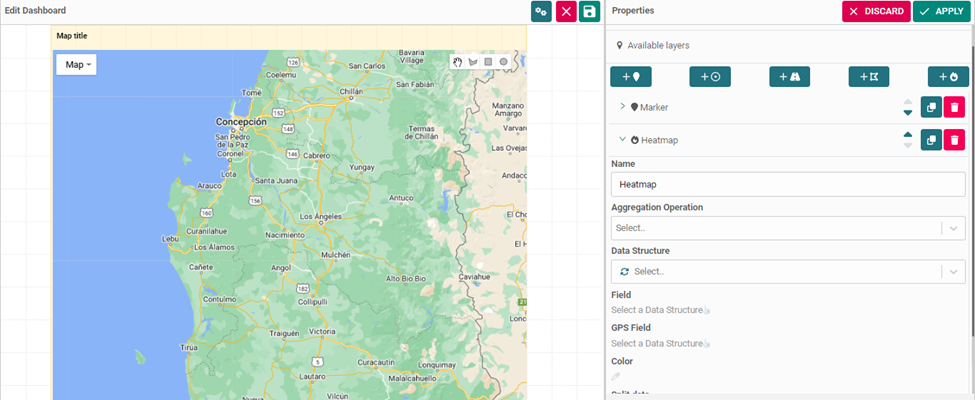
Additionally, we have added a new layer to the Geo map - the Heatmap layer. Its configuration is straightforward and similar to other existing layers in iO.
Data Toolbox
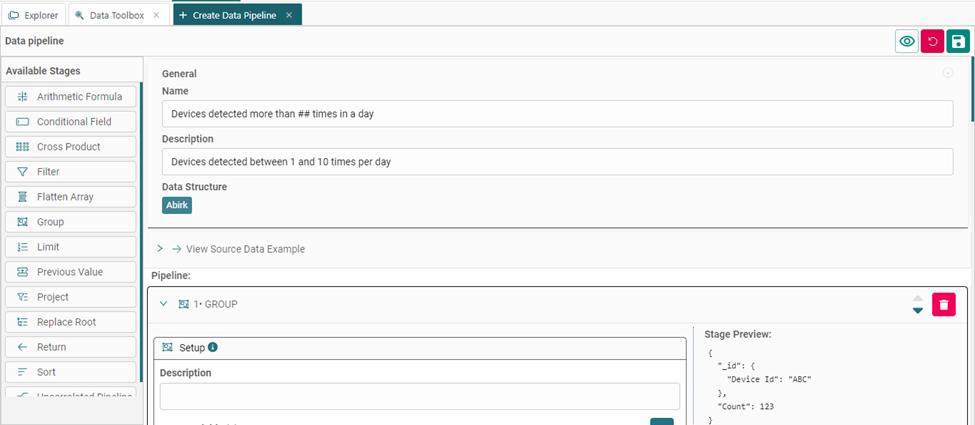
We couldn't wait to share a new tool we bring to iO. Data Toolbox is a sophisticated analytical instrument that empowers you to construct a multi-step ETL process for maximizing the value of your data.
In the upcoming weeks, we'll be dedicating a whole post to this tool, where we'll discuss in depth its capabilities and benefits. Sign up for our newsletter so you don't miss it!
Admin
Easily move a report or a folder
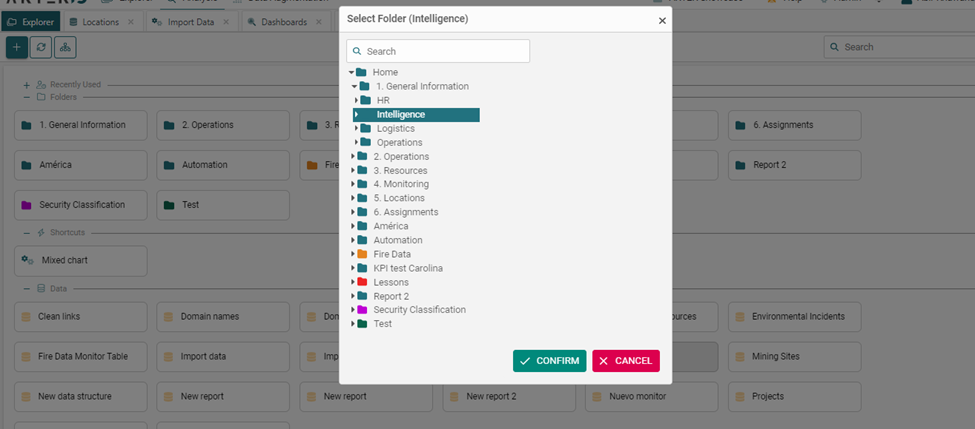
Moving a report or folder is a simple process that can be done from the Explorer page. Right-click on the item you wish to relocate and select "Move". Then, select the new destination folder or sub-folder and click "Confirm".

Smart Filter
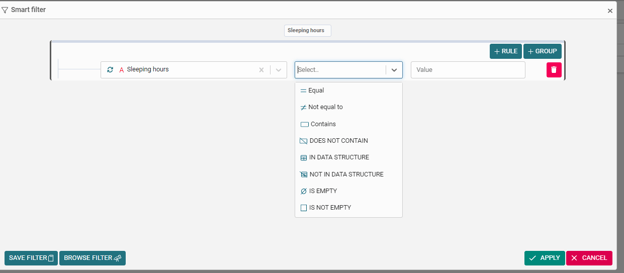
The Smart Filter now includes several new options that will be useful for you to find the specific information you require:
- A "Does not contain" option that is relevant to text fields.
- An "In Data Structure/Not In Data Structure" option. This option allows you to compare the existence of a value in another data structure. Of course, you must define the second data structure and the field to look at.
- An "Is empty/Is not empty" option. Use it to filter out records that have this field empty (or not).
- A "Compare the other fields" option. This option applies to numerical fields and enables you to compare the value of one numerical field in the same table with another (e.g., filter out records where Achieved is less than Targeted).

Want to explore these features?
Request your demo!


