2022 was a fruitful year, and we are grateful for all the good times and challenges it brought. We have great plans for 2023 and are excited to kick this off with the most recent product updates on iO.
Remember that if you are already a customer, you can also go to iO’s helpdesk and check the step-by-step guide to use these new features.
Network
Searchable List
All networks are now listed in one view, where you can search and take action.

General Settings
Under network settings, a new subsection will appear in edit mode for general settings. Here you can edit the network name and set the default data filter and Date &Time filter.
This way, you can reduce the loading time of your network by loading only the filtered data of interest every time you open this network.
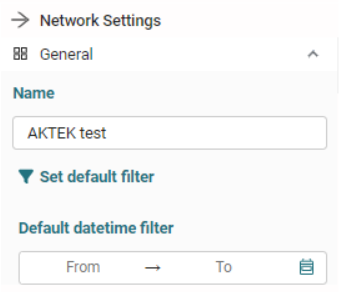
These filters also exist in view mode and can be changed without affecting the default filters.
Scrollable legend
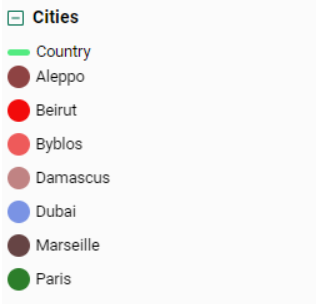
When the list of nodes is long (under legend settings), you’ll be able to see only the top seven on a Network legend to avoid clutter and easily scroll down to navigate the remaining items.
Coming soon: a search bar will be added, allowing you to search and find nodes.
Show Nodes with Links
We’ve replaced the toggle “Show only nodes with links” on the network with the toggle “Filter by links and depth.”
This will allow you to display your Networks to only show nodes with a minimum number of links or only show sub-networks with a minimum link depth.
However, the purpose of this change is to allow you to display only the nodes with two links and more, three links and more, etc., depending on the number you input.
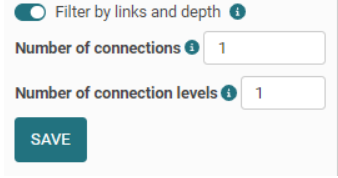
We also added another option to define the number of connection levels. In other terms, how deep you need to go from each node.
This option is available on a report level under Default legend settings if you wish to simultaneously apply the same number for all reports.
Dashboards
Influence Matrix
As shown in the image below, a legend will be displayed when items are on the same level.
Custom Font and Line Thickness
You can control the font size on all charts on both axes by setting the value under Appearance.

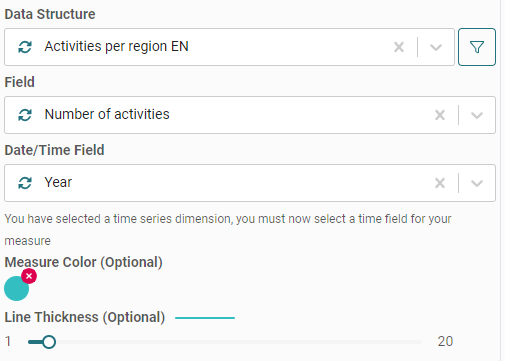
You can also control the line thickness for each measure in line and mixed charts.
Filter on Measure
You can filter each measure added to visualize only the data of interest on the bar, line, and mixed charts. If you apply a filter on the dashboard, iO will combine both filters.
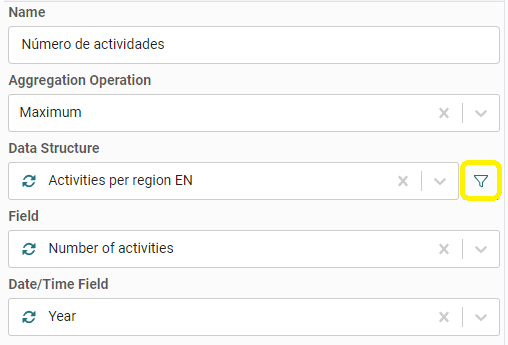
Data structure
Formula
We've improved iO, and now it supports date, time, and date/time fields in the formula field and the results preview.


