Exciting news for all AKTEK iO users! This month, we are thrilled to announce a series of significant updates to our software. We have been working tirelessly behind the scenes to enhance your experience and provide you with even more powerful tools and features.
With these updates, AKTEK iO will take your productivity and efficiency to new heights. Get ready to streamline your workflows and processes and unlock a whole new level of performance.
Dashboard
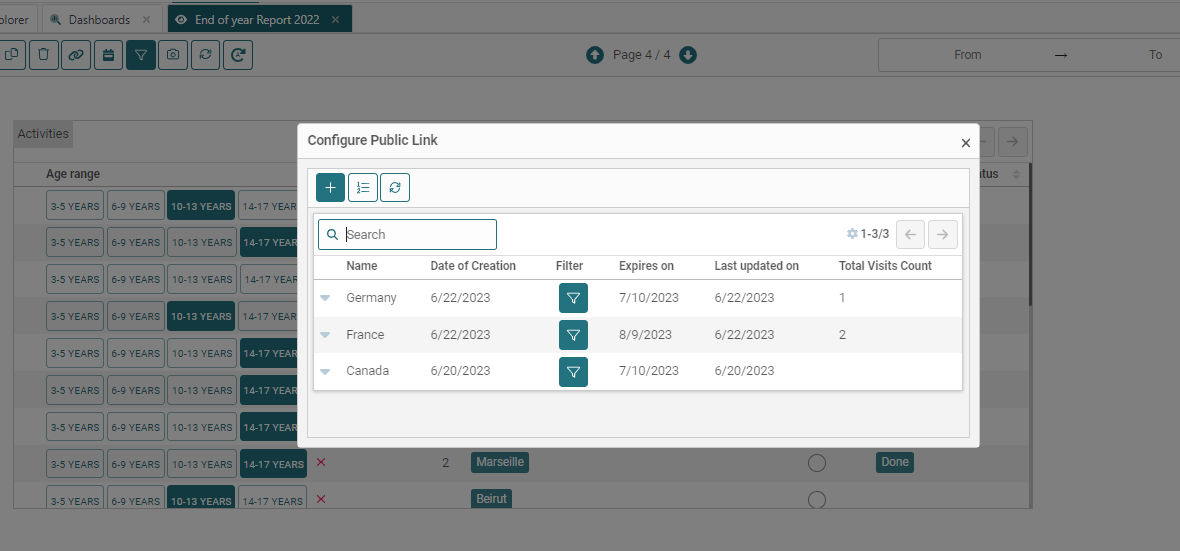
Generate multiple public links with different filters
You can now create numerous public links with filters to cater to different audiences. In specific scenarios, you may have a dashboard that presents information at multiple levels.
If you want to share detailed data from each level with a particular audience, follow these steps:
- Generate a public link for the dashboard.
- Apply a custom filter to display specific data on this link.
- Repeat the process by creating another link for the same dashboard and modifying the filter.
- Share each link with the intended audience accordingly.
- Come back to this view to revoke a link or check the number of views of each link.

Introducing the "Data table" component
To enhance your analytics with a quick overview of the raw data, we have introduced a new component called the "Data table" (You can locate it towards the end of the component list).
Configuring this component is effortless. Select the desired table name and choose the columns you wish to display.
.png?width=209&height=231&name=pasted%20image%200%20(1).png)
.png?width=624&height=242&name=pasted%20image%200%20(2).png)
Formula field now available for graphs
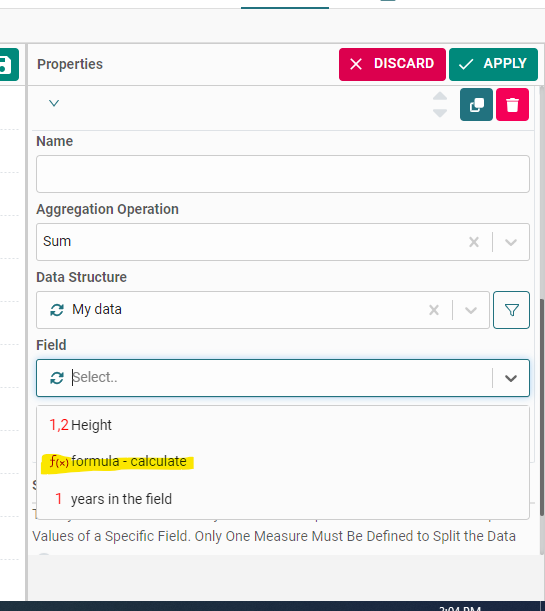
We are delighted to share the exciting news of the formula field's integration into the dashboard component. You can find the formula field under the dimension or measure of your charts.
By leveraging this functionality, you can incorporate pre-calculated information into your analysis, expanding your analytical possibilities.

Chart Title and Legend Placement
You can now choose the chart title and legend placement for personalized chart displays.
Find these options in the Appearance section of the chart. Just click on the appropriate bubble to select your preferred position.
.png?width=521&height=564&name=pasted%20image%200%20(3).png)
Hide/Show a Chart
If you're working on a report and don't want to display a chart yet, you can easily hide it.
Click on the wrench icon of the chart, find the "Hide" option, and save your dashboard.
In view mode, the space where the chart was will appear empty, while in edit mode, a placeholder will occupy that space.
To show the chart again, simply edit your dashboard and click on the same option (hide) again to disable it.
.png?width=624&height=464&name=pasted%20image%200%20(4).png)
Data Structure
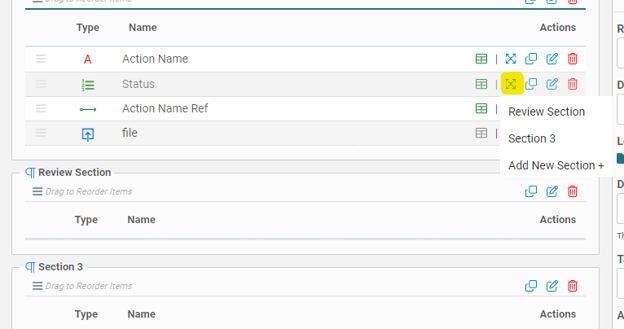
Move fields between the sections
Now you can move a field from one section to another. To do so, locate the "Move to" icon on the right side of the field name. Select the desired section name to which you want to move the field from there.
You can also move the field to a new section, which will be automatically created, and the field will be instantly transferred to it.

Show the name of the month
If you are building your charts using Time series data, we have introduced new aggregations allowing you to showcase the month's name instead of the numerical representation.
.png?width=624&height=218&name=pasted%20image%200%20(5).png)
Ready to try AKTEK iO?
Click here to learn more


