Goodbye October! We're excited to bring you our software's latest developments, trends, and innovations.
Our monthly blog is your guide to exploring the new possibilities we have in store for you. Whether you're an existing customer or just discovering AKTEK iO, you're in for a treat.
Our October update has many exciting new features that will take your experience to the next level.
Here's a glimpse of what's new:
Dashboard
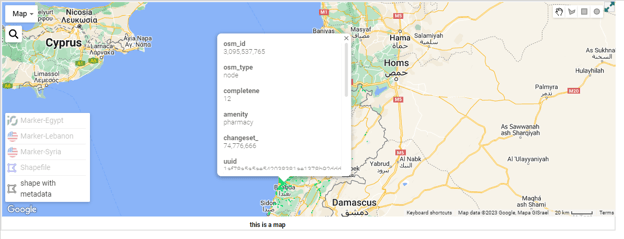
See the metadata and description of your shapefile
We've added a description field to the configuration of the shapefile, where you can add your customized information.
In addition to that, if the file has metadata, it will also be displayed when you click on the shapefile.

Check all the information related to overlapping pins
Whenever you have multiple pins at the same location, or if you have enabled clustering, we have improved the information popup to display all the information related to all records (pins).
To be able to see it, you have to draw a shape filter, right-click, and select the option “View all points within marker and path layers.”
This will open a table with the list of info. Navigate through the layers by clicking on the tabs at the top of the table.
-1.png?width=624&height=280&name=pasted%20image%200%20(1)-1.png)
Track who views your Dashboard’s public links
When creating a dashboard public link, you can now define if you need to ask your visitors about their name/email.
-1.png?width=578&height=287&name=pasted%20image%200%20(2)-1.png)
Come back to the list of your public link and check in the last column the number of visits and who these visitors are.
-1.png?width=624&height=440&name=pasted%20image%200%20(3)-1.png)
-1.png?width=624&height=346&name=pasted%20image%200%20(4)-1.png)
Customize your Radar Chart colors
You can now select the desired colors for your radar chart. Find the Colors section under the Dimension, and choose whether to define the colors randomly, from the color field, or by value.
-1.png?width=624&height=217&name=pasted%20image%200%20(5)-1.png)
Unify the scales in your Radar Chart
As you already know, the minimum and maximum value positions are per measure in the radar chart.
However, based on your use case, you may need to compare all the values together. We have added a toggle under the Appearance settings: Use absolute maximum for all source fields.
This will allow you to unify the scale across all measures.
.png?width=624&height=249&name=pasted%20image%200%20(6).png)
Customize the spacing in your bar charts
Introducing enhanced customization options, you can now specify the gap between your bars, enhancing visual clarity, which can be adjusted based on the number of bars and measures in your data.
You can find this option under the Appearance settings. Add the desired number to Add Category Bar Gap (%) and save to see these changes.
Show the chart legends on multiple lines
On all chart types, you can now decide if you want to show the legend on one or multiple lines (recommended if you generate a PDF for your dashboard).
You can find this option under the appearance settings.
-1.png?width=624&height=369&name=pasted%20image%200%20(7)-1.png)
At AKTEK iO, we're committed to providing you with the best possible experience. Our October update is just the beginning of what we have in store for you, so stay tuned for more exciting updates and innovations.
Don't miss out on the opportunity to explore these features in-depth. If you're an existing customer, simply login to your helpdesk account, and if you're new to AKTEK iO, request a demo today.


.jpg?width=300&name=Blog%20Link%20Preview%20Image%20(2).jpg)
