We are kicking 2023 with full energy and many improvements. Check the list below, and don’t forget to share your feedback with us.
Remember that if you are already a customer, you can also go to iO’s helpdesk and check the step-by-step guide to use these new features.
Dashboard
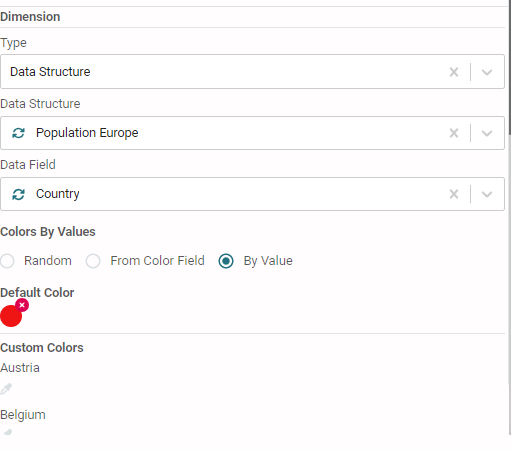
Custom colors on Pie chart
The slices of your pie chart had random colors assigned by the system. With this update, you can assign a color for each slice. This is useful when setting the same color for a specific value on all charts.
The selection of colors is under the Dimension section of the Pie chart configuration.

Multiple measures on the Pie chart
Do you need to compare different data sets on a pie chart? You can do it now by simply adding additional measure(s) to your pie.
When you add more than one measure, the following settings will be activated, and you can control them under Appearance:
Show Label: to display the measure's name + the slice name.
Gap: define the white space between the concentric circles.
Note: all data for different measures should be in the same report.
Admin
Company jobs
You will notice a new section under Admin called iO jobs if you are an agency admin.
Under this section, you can see all the running jobs on all companies owned by this agency. Depending on the features activated under your license, the types of jobs that can show are Automation, Online Traffic Analysis, AMP, Import data from file, or Fire monitor.

Data Structure
Ability to restore deleted fields
Have you or one of your team members deleted a field accidentally? Now, with the right permissions, you can recover the field and all associated data. This feature will appear under the “Advanced” features of Data structure properties.
Ability to clear all data
We have also added to the advanced features of a data structure the possibility of clearing all data sitting in the data table (while keeping the data structure itself).
You need to be careful when assigning permissions related to this feature. The system will also ask for double confirmation, and you need to type the name of the table you want to clear.
Please contact your account manager to enable Advanced properties for you.
Data table
Ability to use the record ID in smart filter rules
If you are applying a filter on a data table, the smart filter now supports the record IDs as well, so you can filter a range of record IDs.
Ability to bulk edit data from matrix view
One of the very useful data entry and editing features is now live! On any data table, you will find a matrix icon on top. When you click it, the whole table will open in a matrix view where you can simply edit any field from any record. If you want to exit without saving, you can click on the list icon to return to the table view.
Note that you can only edit, and you can’t add new records. To add new records, you need to click on the “+” icon, and if needed, you can then click on the matrix to input multiple records.
Network
We are continuously improving the performance of the Network module. If you have large networks, you will notice that the loading time is faster overall.
Additionally, we have added the following improvements:
- Apply a filter on the report directly. This way, you can reduce the loading time of your network by loading only the filtered data of interest the first time you create your network and every time you load your network.
- Now it is possible to see if filtering by node and connection is applied to all reports or a sub-set. Same for “hide all nodes” and for “Gradient View”.
Ready to get started on AKTEK iO?
Click here to learn more.


