Stay up to date with our latest developments for AKTEK iO. These changes have been carefully crafted to streamline your analytics workflow, boost productivity, and empower you with new tools and capabilities.
Already a customer? Explore the updates in-depth by login into your helpdesk account.
Dashboard
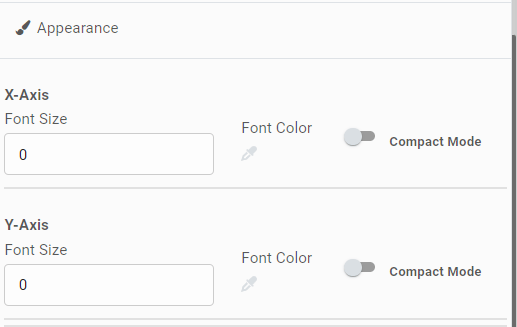
Customizations of the X and Y axes
We have introduced exciting new customization options for legends on axes in all chart types. You can now personalize the legends' font size and font color, allowing you to create visually appealing and tailored visualizations.
In addition, we understand the importance of handling large numbers efficiently.
We have implemented a compact mode feature to enhance readability and improve data comprehension. When enabled, numbers will be displayed in a condensed format, such as 1K for 1000 and 1M for 1000000.
You can find these options under Appearance.
Performance improvements
Continuing our commitment to enhancing user experience, we have implemented performance improvements across the dashboard, focusing on optimizing Geo-maps.
We understand the significance of a seamless and efficient experience, and these updates aim to deliver just that.
You'll notice a marked improvement in the loading speed of the dashboard. Moving between pages is faster and smoother.
We discontinued using mouse scrolling for page navigation. You can still use the up/down arrow on the page.
Regarding Geo-maps, we've made significant strides in handling large datasets. The map can effortlessly accommodate millions of data points without compromising performance.
The layers on the legend now load incrementally, ensuring a smooth user experience.
 Network
Search your node
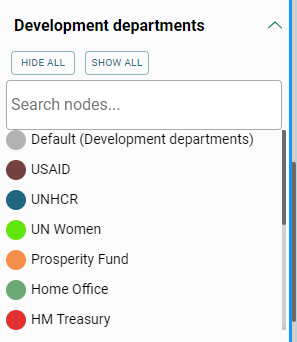
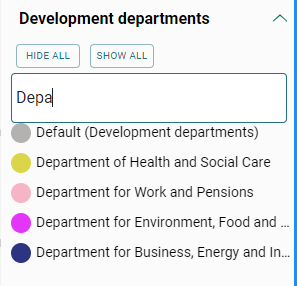
Whenever you have a long list of nodes in the legend, we have introduced a convenient search box at the top. This search feature lets you swiftly locate and access the desired node(s) without scrolling through the entire list.
Once you have found the desired node, you can easily interact with it by enabling/disabling it or simply identifying the color code of this node.
Online Traffic Analysis (OTA)
Analysis by Keywords - Mobile Apps
Previously, iO offered the "Analysis by Keyword - Web" feature, allowing users to obtain a list of websites that matched a specific set of keywords.
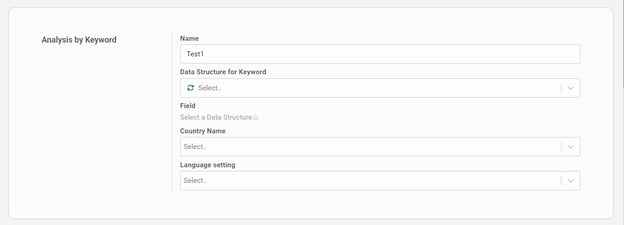
We have expanded this functionality by introducing a new sub-section called "Analysis by Keyword - App."
With this latest addition, you can retrieve a comprehensive list of apps from both the Google Play Store and the App Store that align with your specified keywords.
This enhancement empowers you to explore and analyze the app landscape, providing valuable insights into market trends and competition.
Analysis by Keywords - Web/App
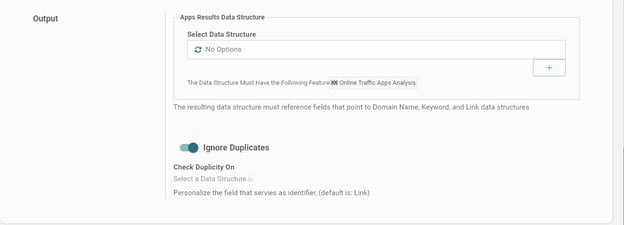
Within the "Analysis by Keywords - Web" section, we have added a new option to save only the newly discovered results.
This functionality is achieved through the "Ignore duplicates" toggle, which, when enabled, allows you to specify the field that determines a duplicate record.
By defining the field, you can establish the criteria for identifying duplicates. If you leave the field empty, the records with the same Link URL will be considered duplicates by default.
Alternatively, you can choose another field, such as the domain, to eliminate duplicates based on your specific requirements.
The same applies to the "Analysis by Keywords - App" section. You can choose to ignore duplicates based on App ID.
Data Toolbox
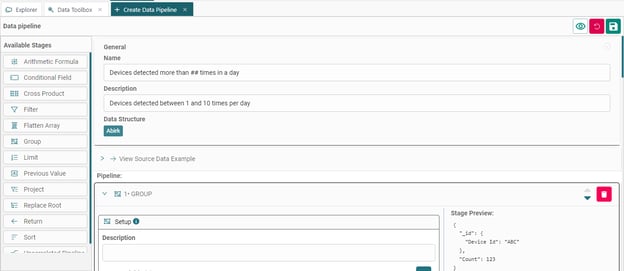
The Data Toolbox is a sophisticated analytical instrument that empowers you to construct a multi-step ETL process for maximizing the value of your data.
You can choose to return and save the processed data in a new report to visualize it on the dashboard or network.
These are a few examples of the benefits of the data toolbox:
- Descriptive Statistics: For example, with the Data Toolbox, you can create a pipeline that identifies the events occurring in the afternoon, disregarding those that took place earlier, and returns the count of events repeated more than five times within a month.
- Data Aggregation: For instance, the data toolbox allows you to run different pipelines on different tables to extract the analyzed data and return the results to one summary table.
- Advanced Analytics: The toolbox offers advanced analytical methods, such as regression analysis, time series analysis, clustering, and classification algorithms.
For example, Time series analysis helps you identify seasonality, trends, and other temporal patterns. You can run a pipeline on your data to identify if more events are happening at the beginning of the month, mid, or end of the month.
Check the Helpdesk for more details about the available stages and how to use them.
Want to explore these features in-depth?
Request your AKTEK iO demo!


