With the summer starting, we have some hot enhancements and new features added to AKTEK iO during June.
As always, if you are already a customer, you can also go to our helpdesk and check our step-by-step guide to use these new features.
Data
Import data from files
Our big surprise of the month: if your data is on an excel file, Google sheet, or any CSV. file, iO will automatically create the data structure and upload the data to the report in just a few clicks!
Go to Admin > Data > Import data from files.
Explore the different options available to import your data. Check our helpdesk for step-by-step guidelines.
Users and Roles
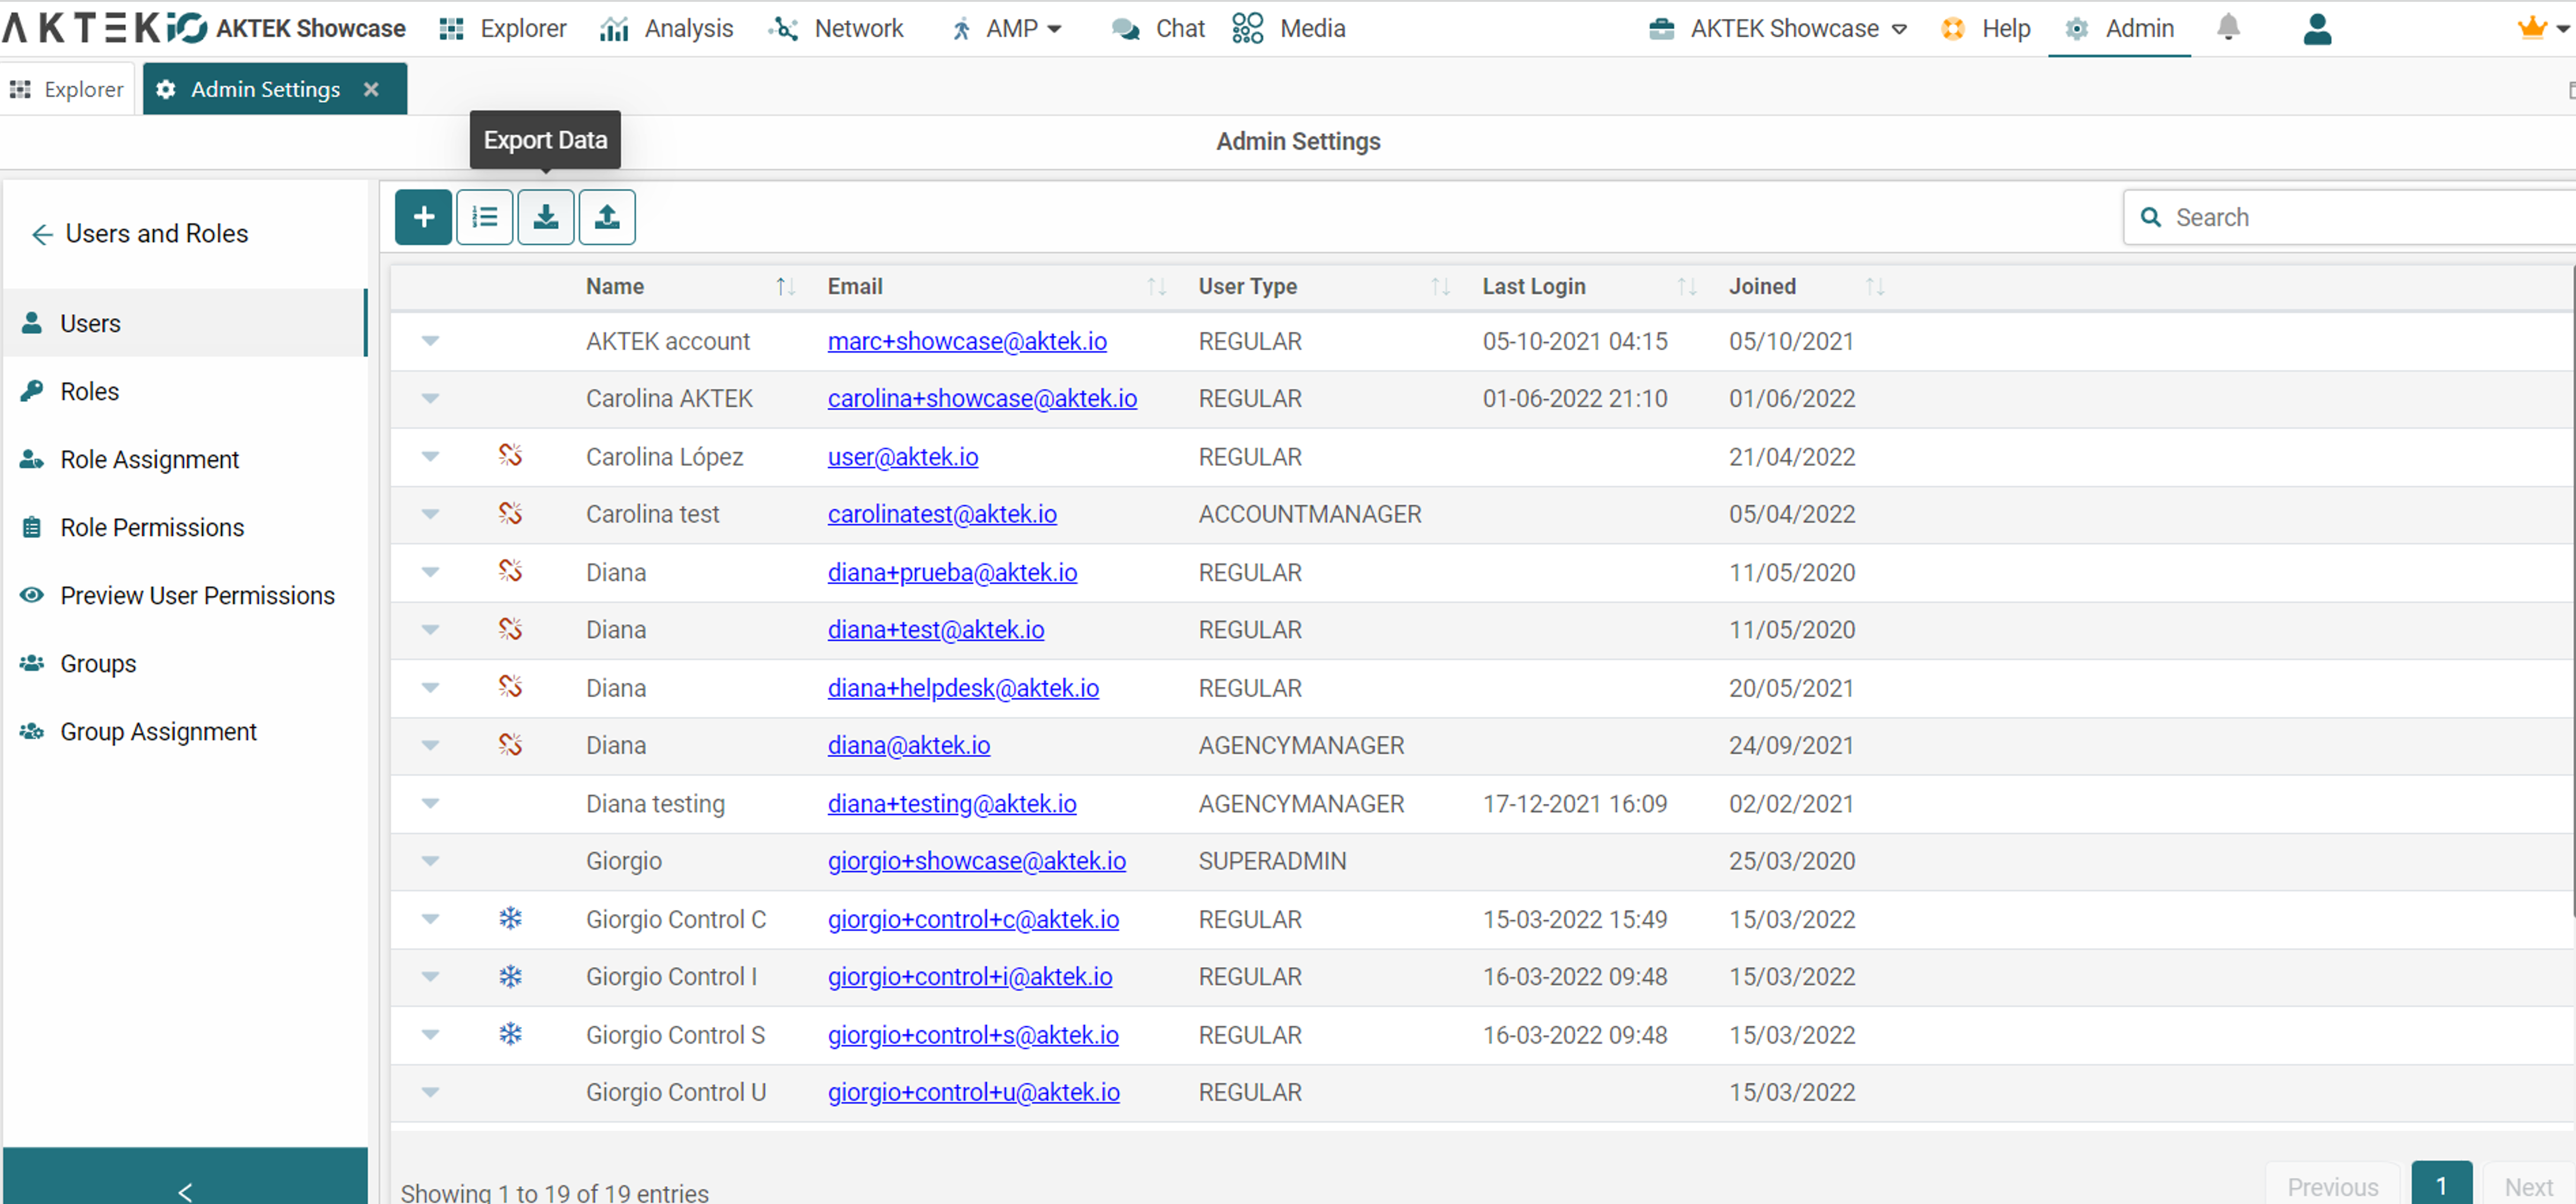
Download User Profiles
On top of the list of users, find Export Data.
When clicked, you will download the list of all users in excel format with all related information.

Bulk Creation of Users
If you need to create more than one user at a time, here is a new feature to create users in bulk from an excel sheet. You can add as many users as your license supports. (The feature itself supports up to 5,000 users).
Find the Bulk Create button on the top left of the Users’ list.
- Download the template
- Fill it out and upload the filled template
- Finally, assign roles to the users (in bulk) and click on Confirm.
Dashboard
Map Base Layer
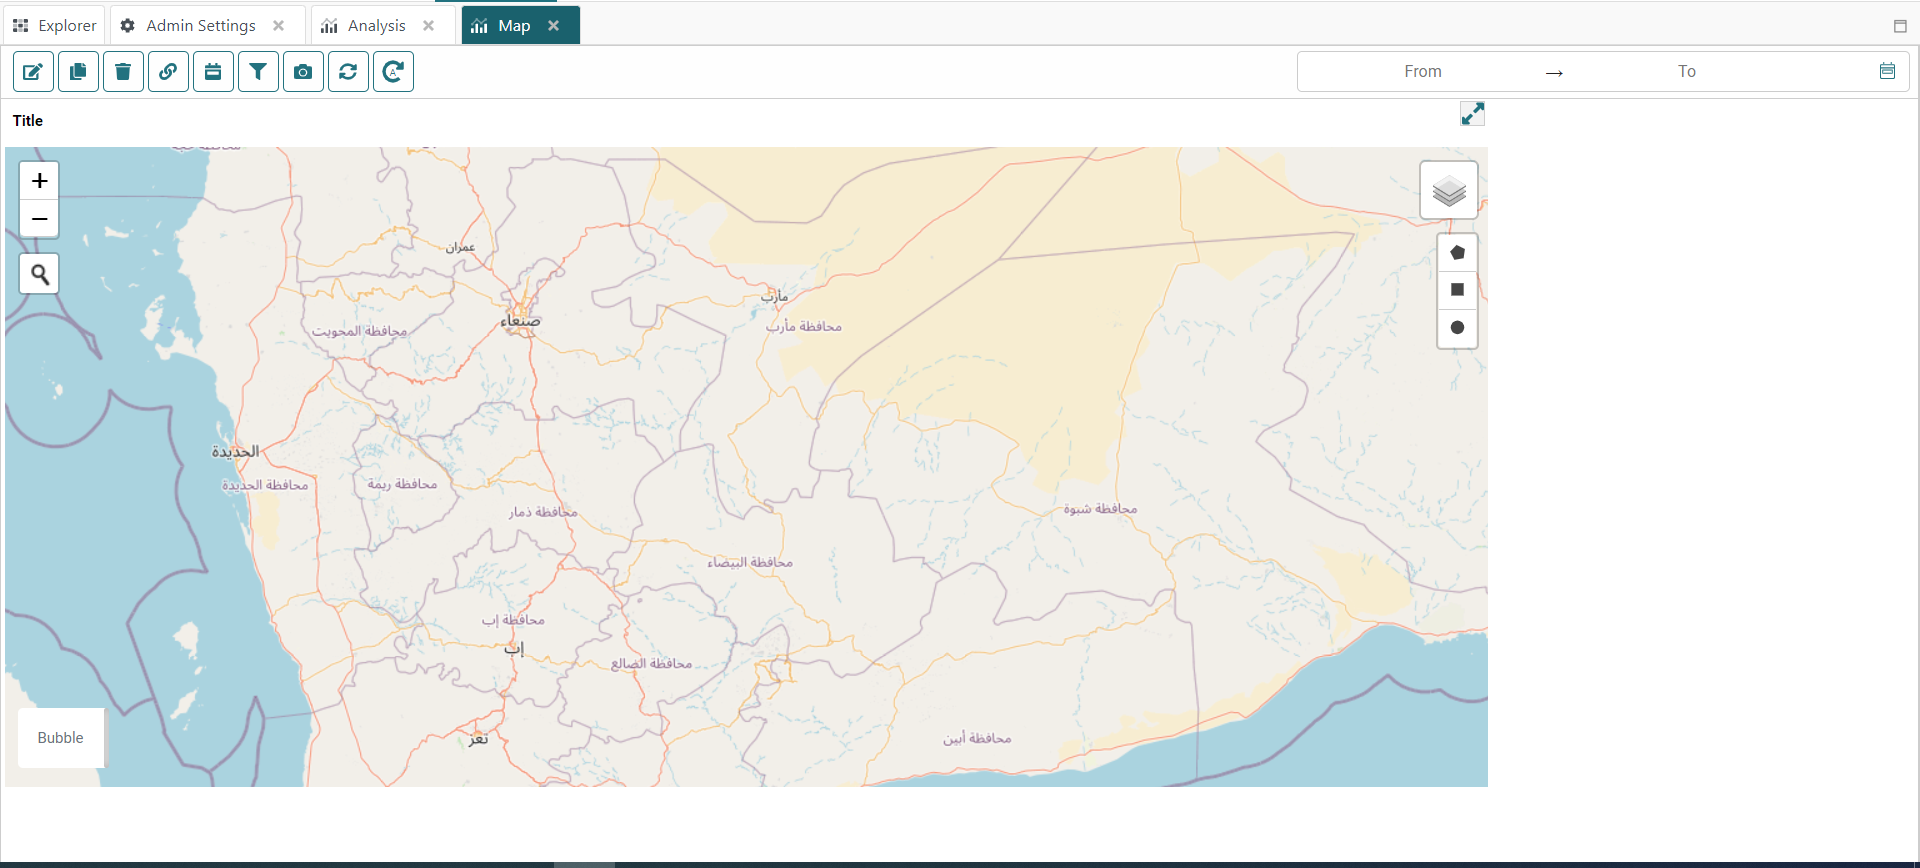
We have changed the default map layer to street-view for better performance and faster data loading. You can always change it to Satellite or Topographic view by clicking on the layers option.

Marker Size
Depending on the amount of information displayed, it’s sometimes convenient to have smaller or bigger markers. Control the marker size from the settings by using the Marker size slider.
Bar Chart
We advise you to add the labels to the bars for a more accurate bar chart, especially when saved as an image or reported as a PDF. The labels represent the dimension value of each bar.
How to do it? In the settings of the bar chart, under appearance, enable the toggle Show Bar Labels.
Pie Chart
If the legend has many values, you can check these different values by scrolling through it. However, this is not convenient when downloading the Pie chart as an image or sharing the dashboard as a PDF.
For these cases, we added a toggle under Appearance settings to show the legend on multiple lines. This will allow the viewer to see all values on the legend and better analyze the chart.
Ready to get started on AKTEK iO?
Click here to learn more.
Moving Components
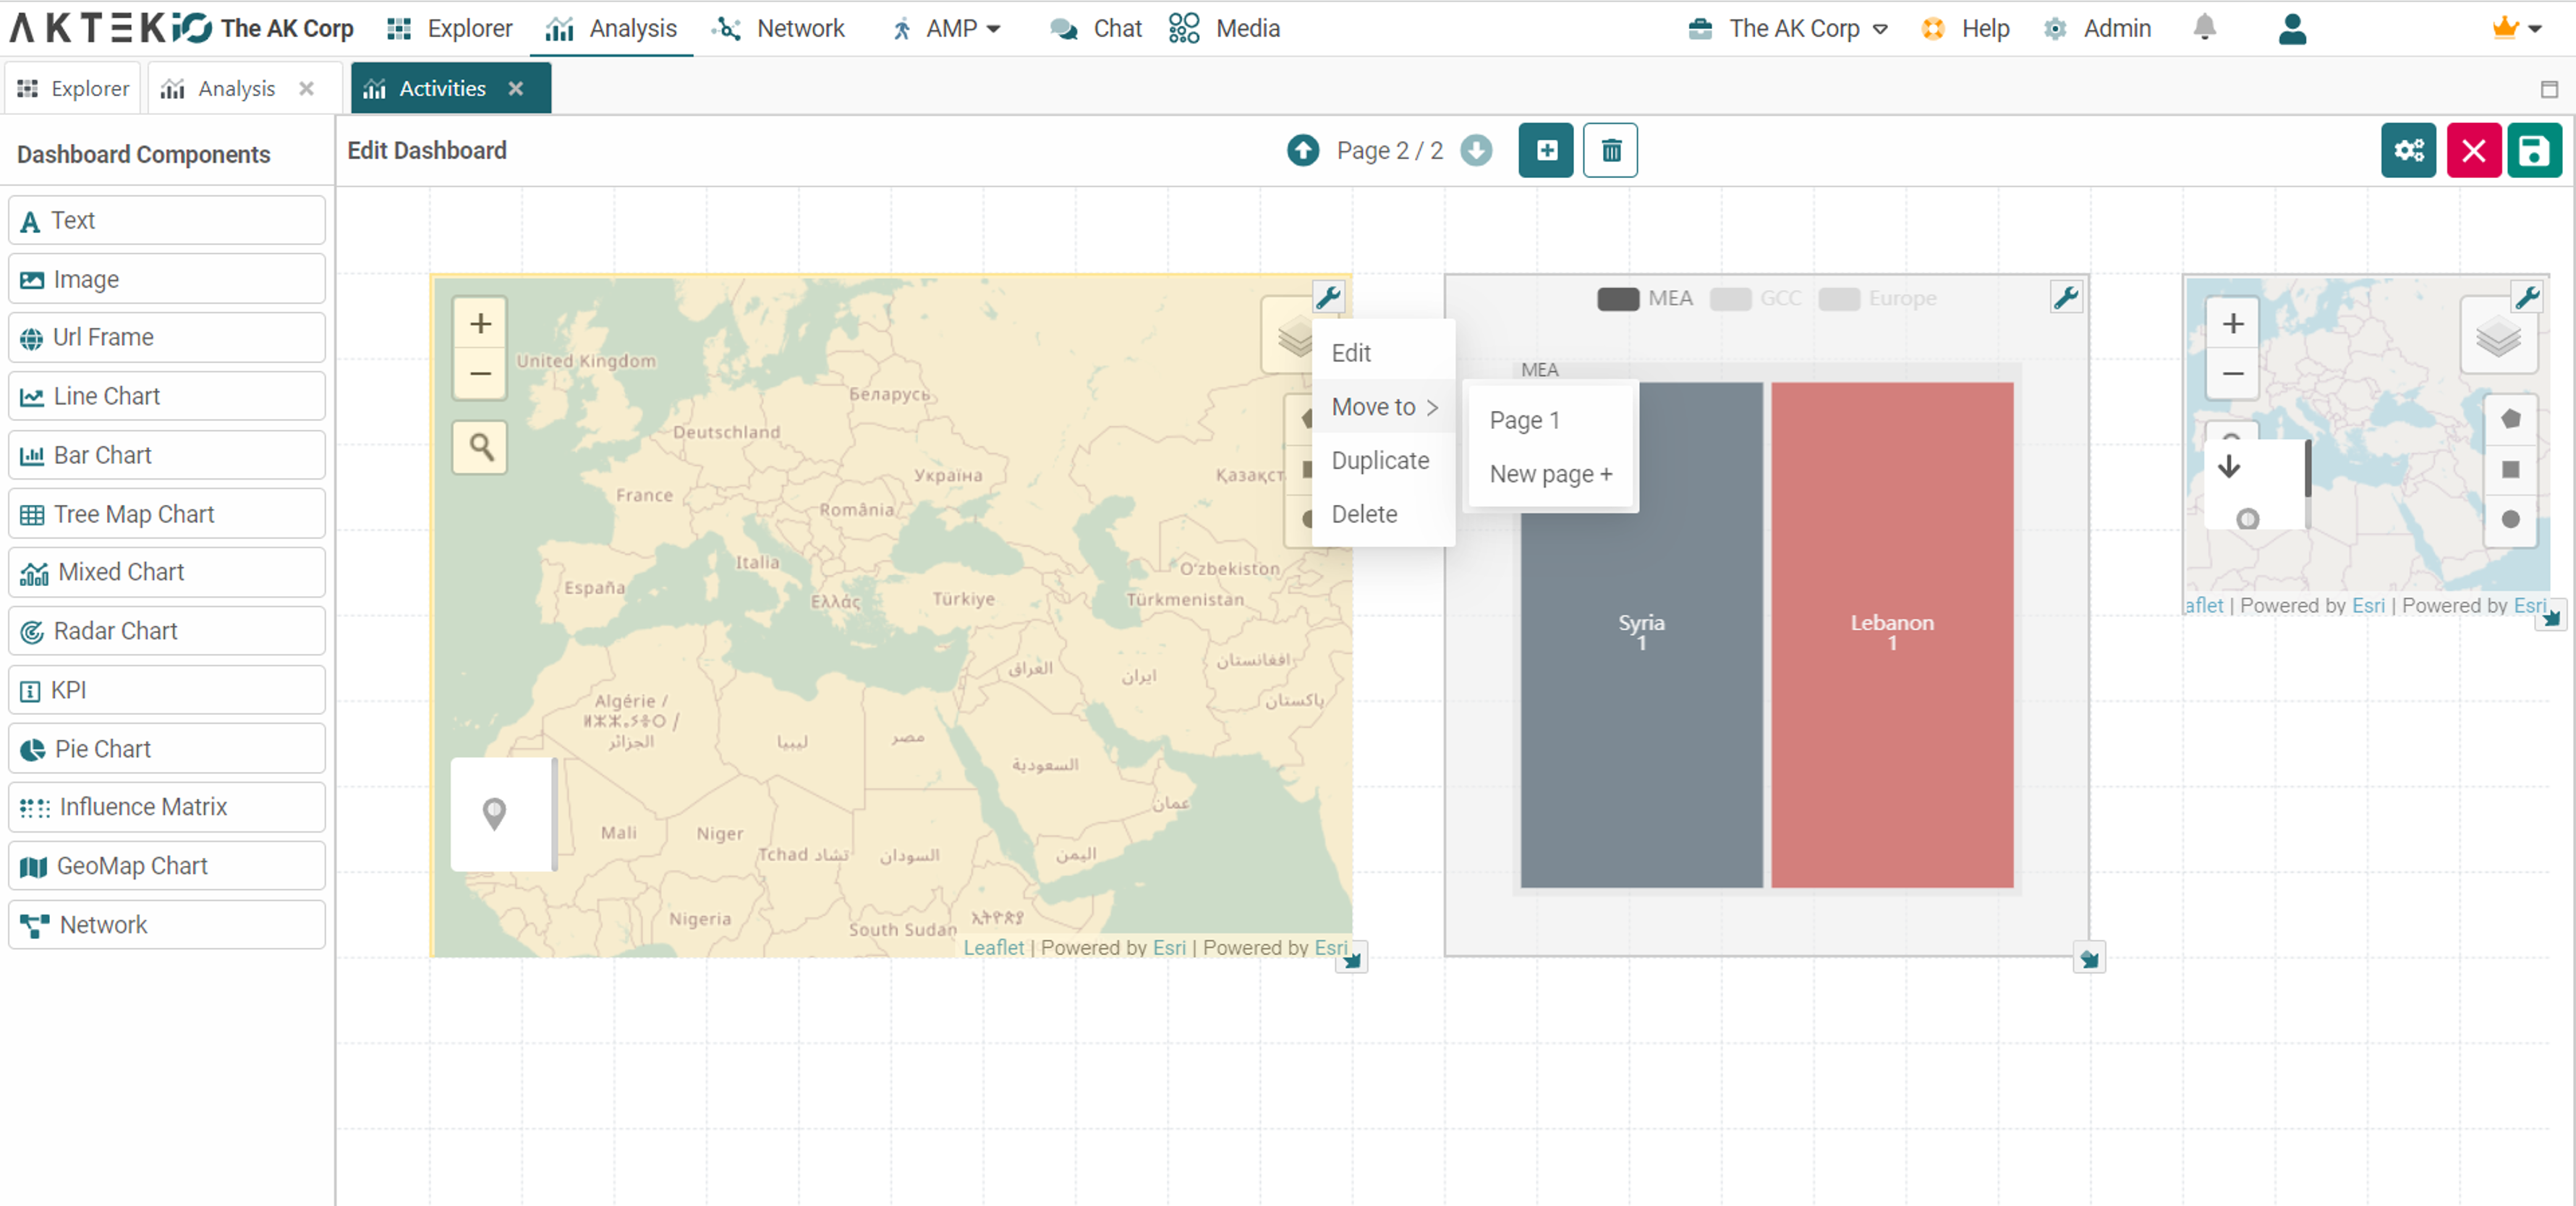
On a multi-page dashboard, move your components easily between the pages.
Click on the wrench icon of your component and select “Move to”. You can either select a page number or move it to a new page (which will automatically get created).

Delete a full-page
On a multi-pages dashboard, instead of deleting the components one by one on a page, you can delete the whole page in one click.
Edit the dashboard > Go to the desired page > find in the middle top the delete icon.
It will show a double confirmation message to avoid accidental deletion.

Tags
Anyone can assign a tag, but you want to allow specific users (roles) to create or delete tags. This is now possible by controlling the permissions. Tag creation and deletion have separate permissions under Roles permissions > Administration.
Network
Under Node settings, we have added the Reference fields to the Display Field options.
MEDIA
You are able again to export the mentions feed as CSV. You can export data for the author’s real name, author username, network, domain, a post created at, raw body text, sentiment score, hashtags, activity URL, is reshared (true/false), is comment (true/false), reach (number) and then upload it to iO for analysis purposes if desired, or just generate a document to play with this data.
Also, you’ll be able to click on an item to get a quick look at the top mentions in a given monitor with the Top Mentions Digest tool.


-1.jpg?width=300&name=Blog%20Link%20Preview%20Image%20(5)-1.jpg)
-png.png)